
Student Achievement Plan: Upper Grand DSB
2022-2023 Academic Year |
2021-2022 Academic Year |
|
|---|---|---|
Achievement of Learning Outcomes in Core Academic Skills |
Preparation of Students for Future Success |
Student Engagement & Well-Being |
| Goal: Improve student’s literacy learning and achievement | Goal: Improve students’ graduation rates and preparedness for future success | Goal: Improve students’ participation in class time and learning |
Measure: Percentage of student who met or exceeded the provincial standard on EQAO Assessments for Grade 3/6 Reading and Writing and % of first time eligible students who were successful on the Ontario Secondary School Literacy Test (OSSLT)
 |
Measure: Percentage of students graduating with an OSSD within five years of starting Grade 9 includes students who began Grade 9 in 2017-2018 and tracks their progress until 2021-2022 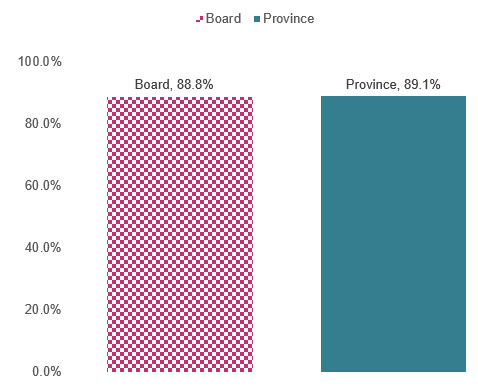 |
Measure: Percentage of students in Grades 4-12 who were suspended at least once.
 |
|
Goal: Improve student’s math learning and achievement Measure: Percentage of students who met or exceeded the provincial standard on EQAO Assessments for Grade 3/6/9 Math. 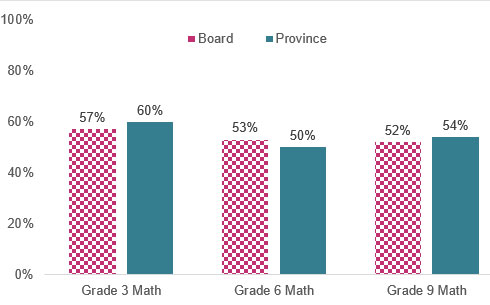 |
Measure: Percentage of students who earn 16 or more credits by the end of Grade 10. 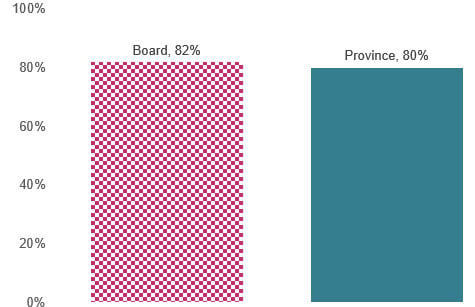 |
Measure: Percentage of students in Grades 1-8 whose individual attendance rate is equal to or greater than 90 percent 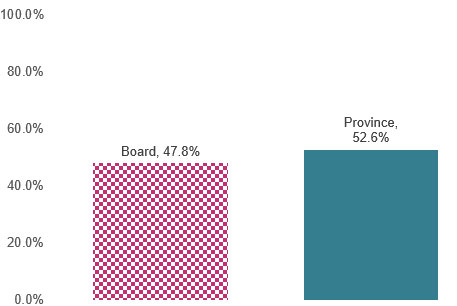 |
Measure: Percentage of students enrolled in at least one Grade 12 math or Grade 11 or 12 science courses
 |
Measure: Percentage of Grade 6,9 and 10 students who report being aware of mental health supports and services in order to seek supports for mental health
DATA FORTHCOMING |
|
Measure: Percentage of students participating in at least one job skills program (specialist High skill Major, Dual Credits or Ontario Youth Apprenticeship Program)
 |
||
| Measure: Percentage of students who believe their learning has prepared them for the next step in their learning experience (i.e. next grade, post secondary, etc.)
DATA FORTHCOMING |
||
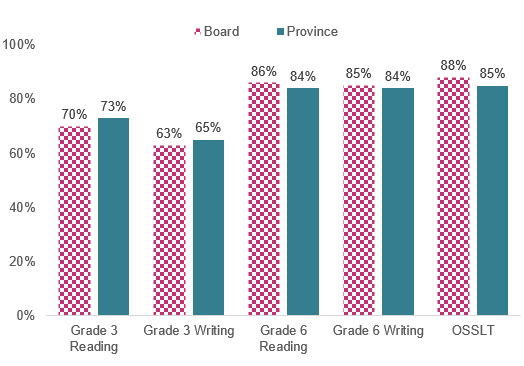
Table 1: Achievement of Learning Outcomes in Core Academic Skills, 2022-2023
| Goals | How This is Measured | School Board Performance | Provincial Performance | Actions School Board Will Take to Improve |
|---|---|---|---|---|
| Improve Student’s Literacy and Learning Achievement | Percentage of Students who meet or exceed the provincial standard on Grade 3 EQAO Reading | 70% | 73% | Let’s GO! UGDSB |
| Improve Student’s Literacy and Learning Achievement | Percentage of Students who meet or exceed the provincial standard on Grade 3 EQAO Writing | 63% | 65% | |
| Improve Student’s Literacy and Learning Achievement | Percentage of Students who meet or exceed the provincial standard on Grade 6 EQAO Reading | 86% | 84% | |
| Improve Student’s Literacy and Learning Achievement | Percentage of Students who meet or exceed the provincial standard on Grade 6 EQAO Writing | 85% | 84% | |
| Improve Student’s Literacy and Learning Achievement | Percentage of fully participating, first time eligible students who are successful on the OSSLT/TPCL | 88% | 85% | |
| Improve Student’s Math Learning and Achievement | Percentage of Students who meet or exceed the provincial standard on Grade 3 EQAO Math | 57% | 60% | |
| Improve Student’s Math Learning and Achievement | Percentage of Students who meet or exceed the provincial standard on Grade 6 EQAO math | 53% | 50% | |
| Improve Student’s Math Learning and Achievement | Percentage of Students who meet or exceed the provincial standard on Grade 9 EQAO math | 52% | 54% |
Table 2: Preparation of Students for Future Success, 2021-2022
| Goals | How This is Measured | School Board Performance | Provincial Performance | Actions School Board Will Take to Improve |
|---|---|---|---|---|
| Improve Students’ graduation rates and preparedness for future | Percentage of students who earn 16 or more credits by the end of Grade 10 | 82% | 80% | Let’s GO! UGDSB |
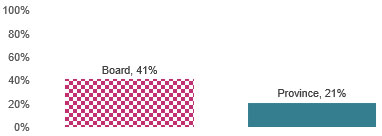
| Improve Students’ graduation rates and preparedness for future | Percentage of students participating in at least one job skills program (SHSM, Dual Credits, or OYAP) | 41% | 21% | |
| Improve Students’ graduation rates and preparedness for future | Percentage of students graduating with an OSSD within 5 years of starting Grade 9 | 88.8% | 89.1% | |
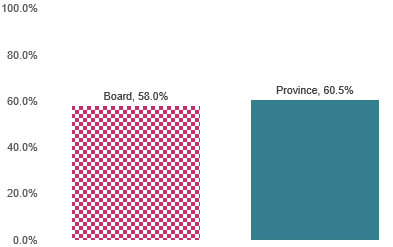
| Improve Students’ graduation rates and preparedness for future | Percentage of students enrolled in at least one Grade 12 math or Grade 11 or 12 science course | 58.0% | 60.5% | |
| Improve Students’ graduation rates and preparedness for future | Percentage of students who believe their learning prepared them for the next step in their learning experience (i.e.next grade, post secondary) | Forthcoming | Forthcoming |
Table 3: Student Engagement and Well-Being, 2021-2022
| Goals | How This is Measured | School Board Performance | Provincial Performance | Actions School Board Will Take to Improve |
|---|---|---|---|---|
| Improve Students’ participating in class time and learning | Percentage of students Grade 1-8 whose individual attendance rate is equal to or greater than 90 percent | 47.8% | 52.6% | Let’s GO! UGDSB |
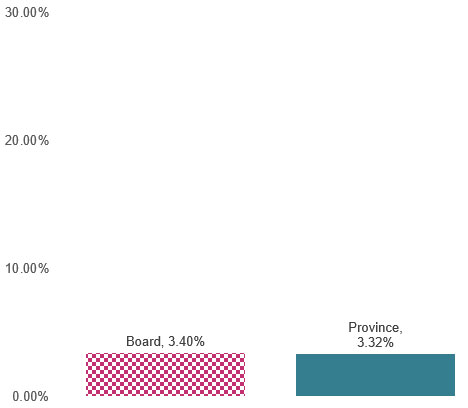
| Improve Students’ participating in class time and learning | Percentage of students in Grades 4-12 who were suspended at least once | 3.40% | 3.32% | |
| Improve Students’ well-being | Percentage of Grade 6, 9 and 10 students who report being aware of mental health supports and services in order to seek supports for mental health | Forthcoming | Forthcoming |
Source: As reported by schools through the Ontario School Information System (OnSIS) 2021-2022, and the Education Quality and Accountability Office (EQAO) 2022-2023